“Why did East grow?” Two new distributors started in May.
Dashboards
Data analytics
Data engineering
Machine learning
AI engineering
Dashboards
Data analytics
Data engineering
Machine learning
AI engineering
Dashboards
Data analytics
Data engineering
Machine learning
AI engineering
Dashboards
Data analytics
Data engineering
Machine learning
AI engineering
Power BI
Tableau
Python
SQL
dbt
Airflow
Snowflake
Databricks
Azure
AWS
React
Node.js
D3.js
PyTorch
Amazon Bedrock
Claude
Power BI
Tableau
Python
SQL
dbt
Airflow
Snowflake
Databricks
Azure
AWS
React
Node.js
D3.js
PyTorch
Amazon Bedrock
Claude
Working with the United Nations in Sri Lanka
We partner with UN Sri Lanka and WFP Sri Lanka on the data systems behind their programme reporting.
World Food Programme Sri Lanka
We work with WFP Sri Lanka on field data pipelines and monitoring dashboards, so programme teams can follow activities by district as data arrives.
What we work on together
Pipelines from mobile field surveys to a central warehouse
District-level monitoring dashboards
Automated weekly and monthly reports
Try a district monitoring view
Sample data for demonstration. Select a district or change the measure.
Colombo76%Data completeness, ranked 19 of 22
Field surveys synced
429
Hours since last sync
14 h
LowerHigher
Top districts
Five disciplines, one connected stack
Each service stands on its own, but they work best together: clean pipelines feed reliable analysis, which feeds dashboards, models and AI you can trust.
Dashboards people open every morning
We design Power BI and web dashboards around the handful of numbers your team decides on, then wire them to live data so nobody rebuilds a report by hand again.
What you get
KPI definitions agreed with each stakeholder
Power BI reports with clean DAX and data models
Custom React dashboards when Power BI is not enough
An interactive climate dashboard built on NOAA's Oceanic Niño Index. It tracks how warm the tropical Pacific is today, compares this year with the strongest El Niño years on record, and ranks every episode since 1950.
Source: NOAA Climate Prediction Center, Oceanic Niño Index (3-month running mean of ERSST.v5 sea surface temperature anomalies in the Niño 3.4 region), 919 seasons from DJF 1950 to JJA 2026. Episodes follow the historical rule of at least five overlapping seasons beyond ±0.5 °C. Since February 2026 NOAA uses the Relative Oceanic Niño Index (RONI) for official ENSO status, so official labels can differ from this view.
Projects we have delivered
Websites and platforms for public bodies and businesses in Sri Lanka and the UK. Pick a card to see the project.
01 / 05
dmc-elnino.vercel.app
Public sector · Sri Lanka
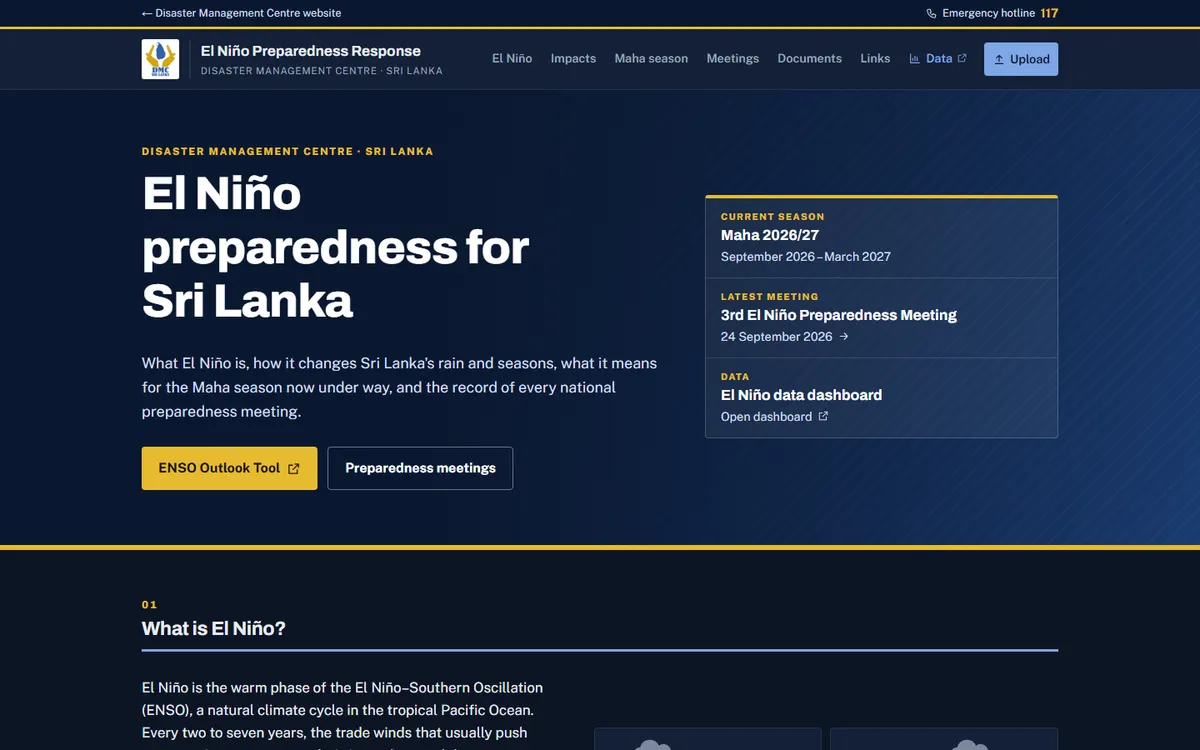
El Niño Preparedness Response
A public information site explaining how El Niño affects Sri Lanka and the Maha season, with minutes and recordings from every national preparedness meeting.
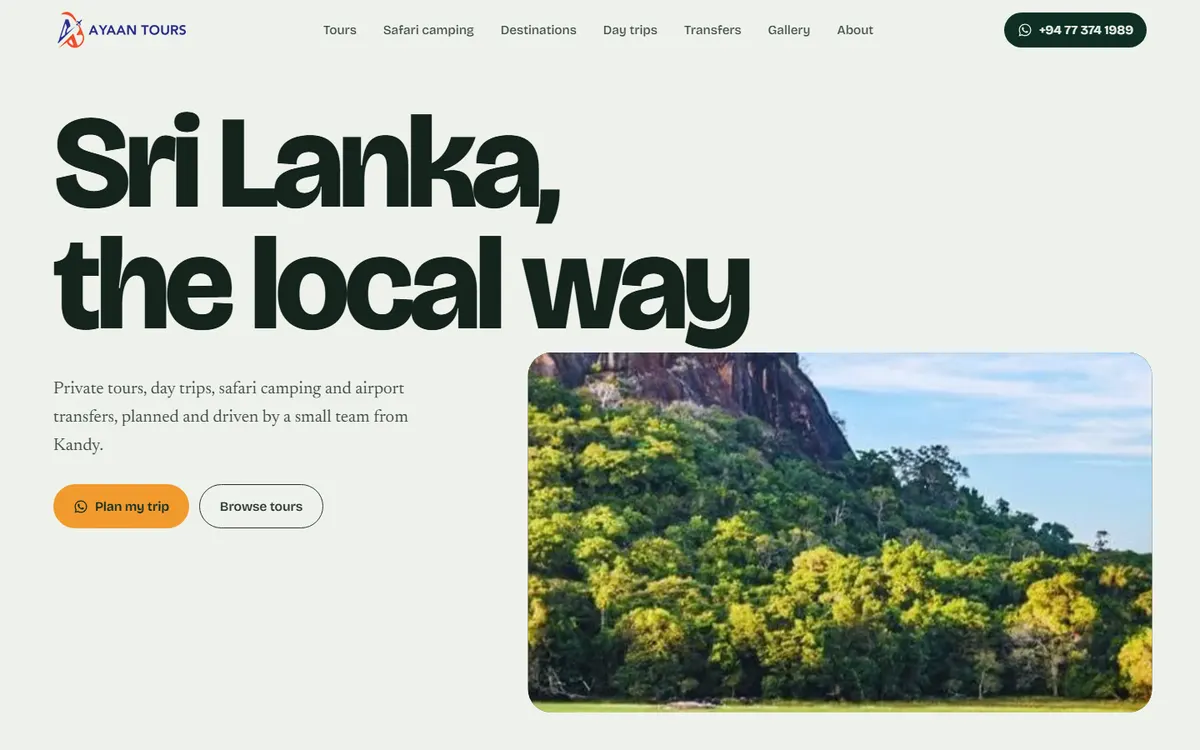
A bookings-first site for a small Kandy tour team: multi-day trips, safari camping in Yala, Kumana and Wilpattu, day tours and airport transfers, with WhatsApp enquiries.
Drag the handle to compare a typical monthly report before and after we automate it.
Before: 3 days by handAfter: refreshes itself
⟷
3 days → 0manual work each month
Formula errors → testschecks run before every refresh
One file → one linkeveryone sees the same numbers
Watch a pipeline run
Every night, data moves from your systems to your dashboards. Run it here, then try it with bad data to see how problems get caught before anyone sees them.
SourcesCRM, ERP, survey app
IngestPull new records
ValidateRun quality checks
Transformdbt models
WarehouseLoad clean tables
DashboardRefresh reports
nightly_refresh.log
Press “Run pipeline” to start.
ReadyNothing has run yet.
Select a layer to see what it involves.
Good AI starts with boring, reliable data
Most dashboards and models fail because of what sits underneath them. We work across the whole stack, so the insight at the top is only as confident as the data allows.
Scoped to your questions
Every engagement starts from the decisions you need to make, not from a tool we want to sell.
Built to be owned
Code lives in your repositories, models are documented, and your team can run it without us.
Honest about data quality
If the data cannot support the answer yet, we tell you early and fix the foundation first.
How much time goes into manual reporting?
Move the sliders to match your team. Automated pipelines and dashboards usually remove most of the copying, cleaning and formatting behind recurring reports.
Estimated time back each year2,074 hours
259working days
51.9full-time weeks
Manual today
After automation
A rough estimate based on your inputs, not a quote.
Four stages, with something working to review at the end of each.
1
Discover
We map your data sources, the decisions you need to make and what is blocking them today.
2
Design
You get a written plan: architecture, scope, timeline and what done looks like.
3
Build
We deliver in two-week cycles and show working results at the end of each one.
4
Hand over
Documentation, training and a support window so your team owns what we built.
Common questions
Yes. Most of our work runs remotely, with regular video check-ins and shared project boards, so location is rarely a constraint.
Yes. We often start by fixing the data model and refresh setup behind existing reports before building anything new.
We work inside your cloud accounts wherever possible, follow your access policies, and keep personal data out of development environments.
A focused dashboard or pipeline usually takes 3 to 6 weeks. Machine learning and AI projects start with a 2-week feasibility phase so you know what is realistic before committing further.
Yes. We offer monthly support plans for monitoring, fixes and small improvements, or we can train your team to take it on fully.
Let's talk about your project
Tell us the decision you need to make and where your data lives today. Email us or give us a call, and we'll reply within two working days.